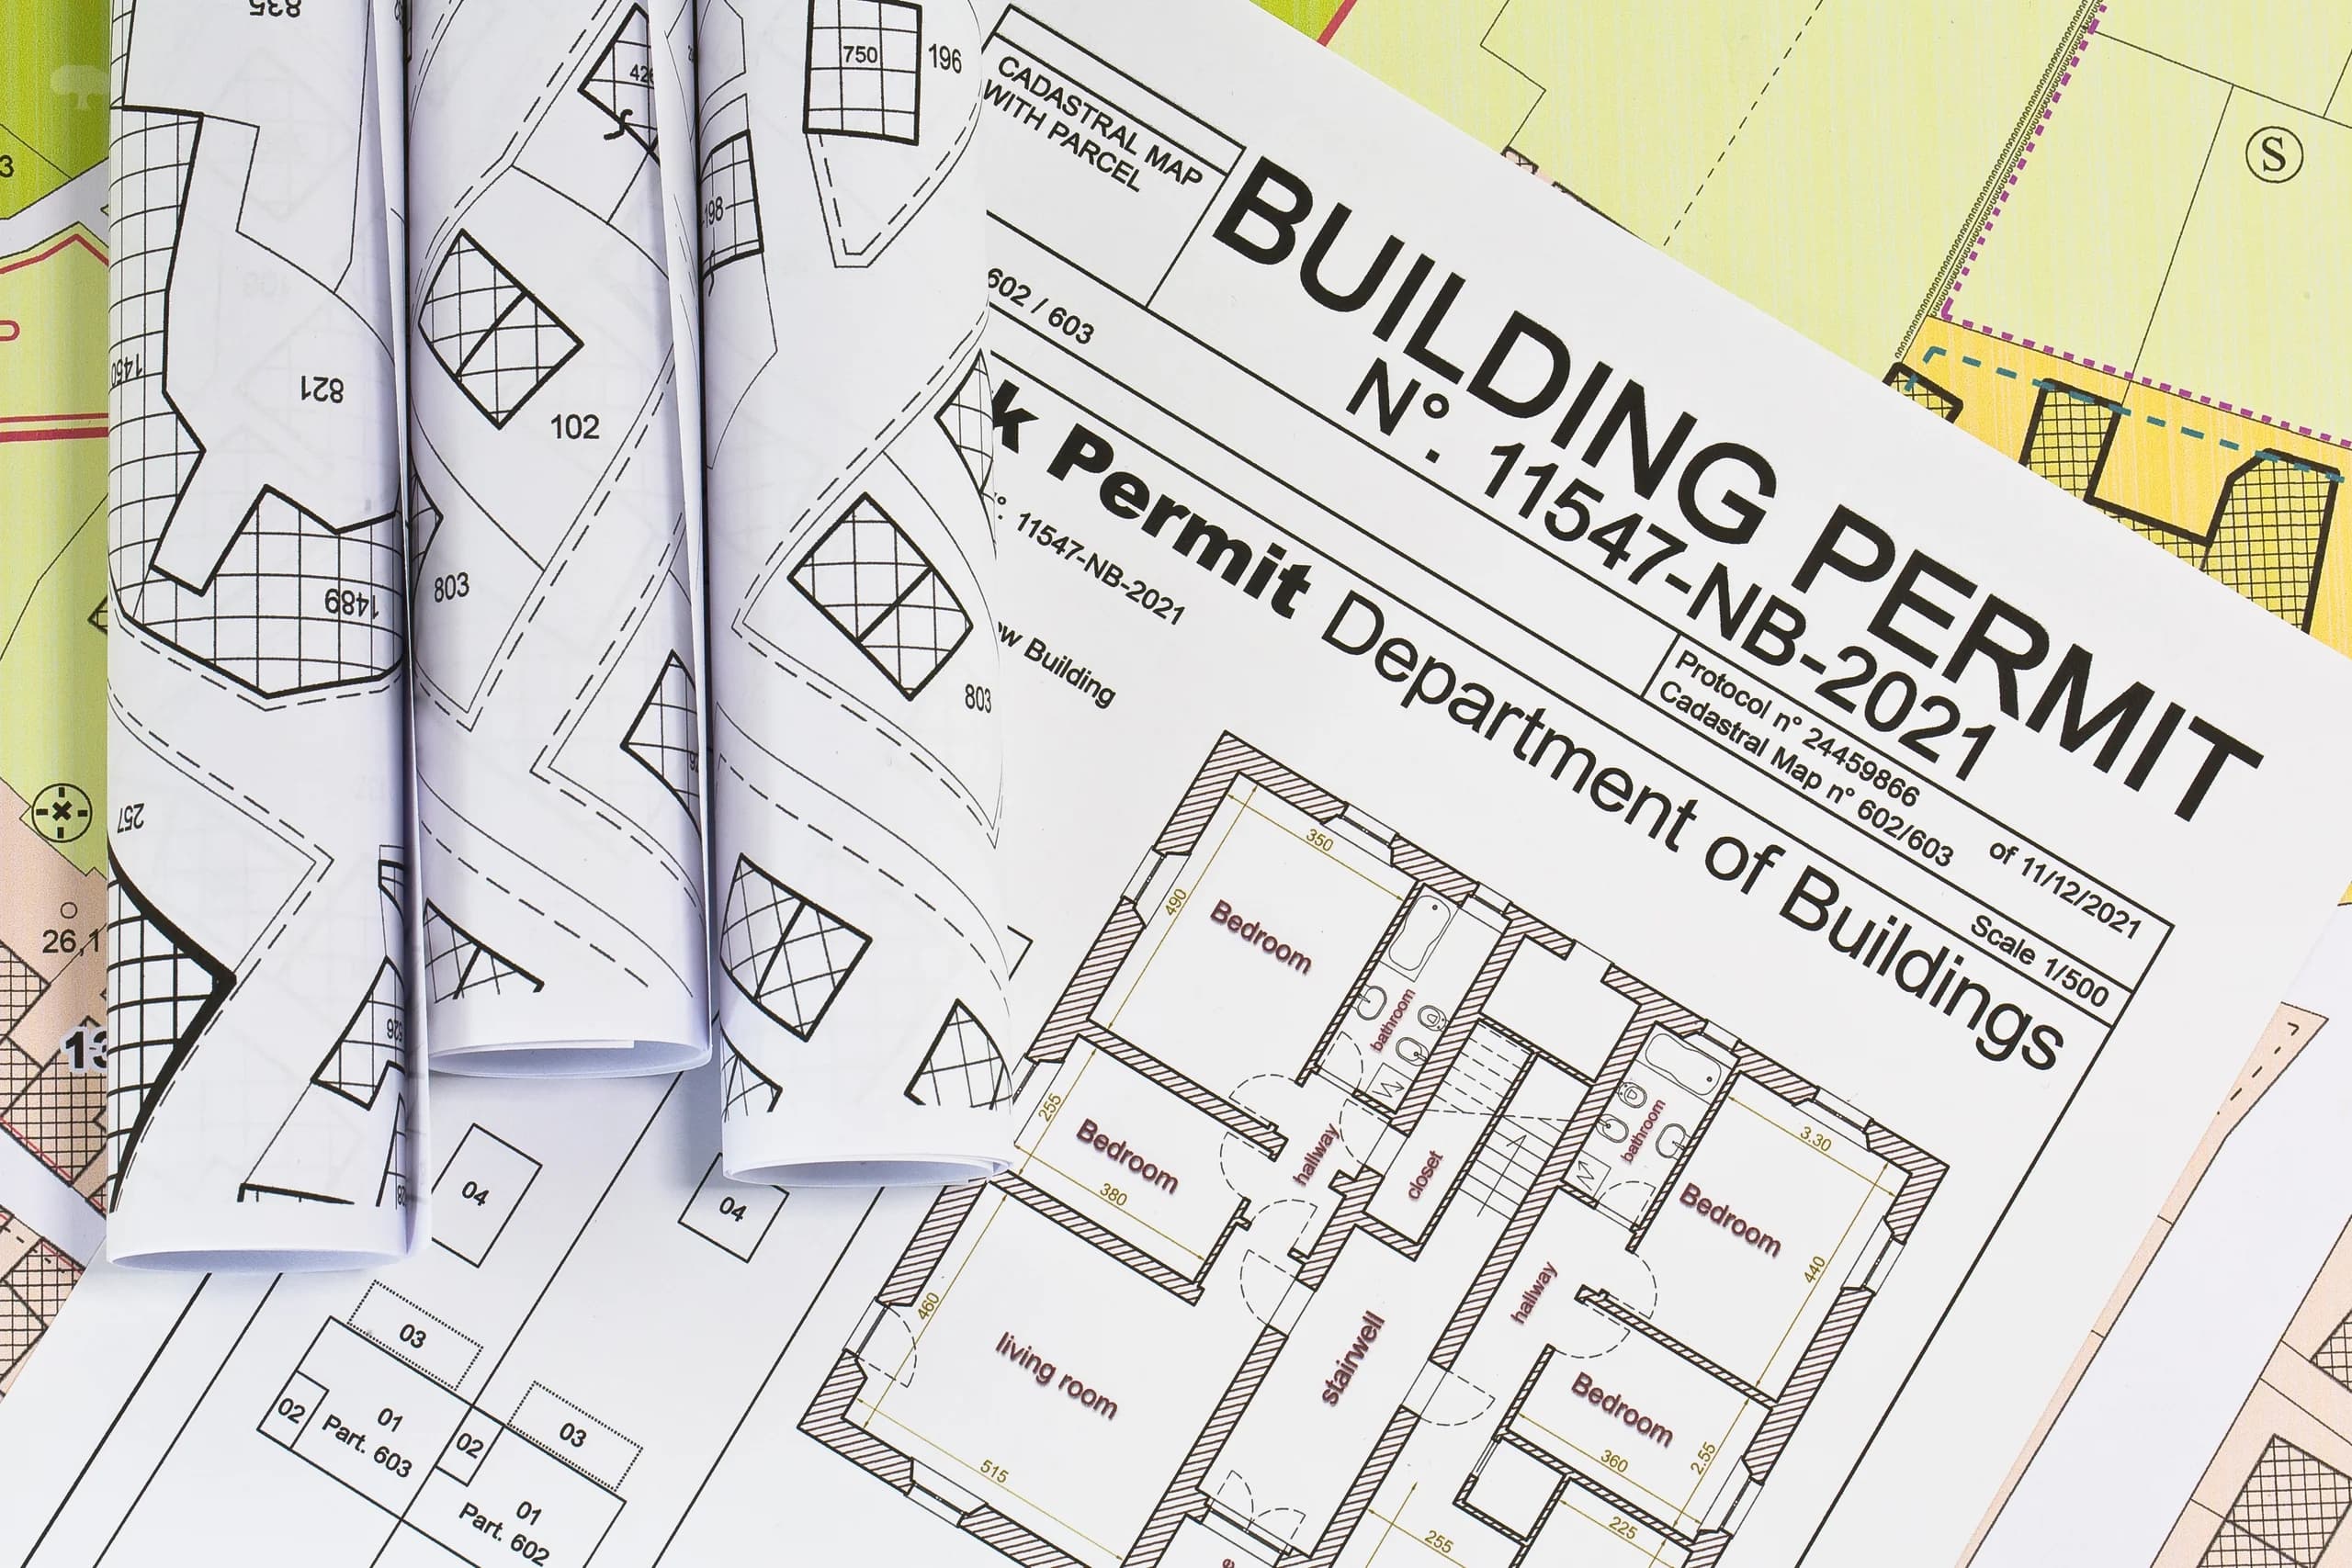
Building Permits Fell 17.3% in July, With Ontario Down 25.2% and Single-Family Approvals at 4,100
Why the Headline Drop Is Mostly an Institutional Reversal, and What the Housing Numbers Underneath It Mean for Owners
By
Published: September 16, 2026, 12:13 p.m. ET
Fact-checked · , including Statistics Canada, CMHC & Department of Finance Canada
Credit: Shutterstock
Key Takeaways
•The 17.3% national drop was led by non-residential permits. Residential permits fell 8.9%, and most of that decline came from multi-unit projects.
•Ontario's 25.2% decline came mostly from institutional projects. Its residential permits fell only 4.8% in the month but were down 14.0% from a year earlier.
•Single-family authorizations barely moved, but CMHC's same-day data show fewer completions and a growing backlog of approved projects that haven't started. Renovation costs face tariff pressure on cabinets, vanities and metals.
Statistics Canada reported on September 16, 2026 that the value of building permits issued across Canada fell $2.6 billion in July, a 17.3% drop to $12.2 billion. That more than erased June's gain. Ontario fell 25.2%. Municipalities nationwide authorized about 4,100 single-family dwellings. Economists had expected a much smaller decline, so the headline was a surprise.
For homeowners, the number that matters is not the headline. It is what sits underneath it. Permits are the earliest official signal of what will be built, so they shape future competition for existing homes and demand for the trades and materials that renovations depend on. A month like this one needs to be taken apart before it can be used.
This article does that in four steps: what actually fell, why Ontario's number looks worse than its housing data, how July fits into the full construction pipeline, and what it may mean for detached-home owners and renovation budgets. Facts come first. Interpretation is labelled as interpretation.
Stay on top of Canadian homeowner news
What Fell in July, and by How Much
The national breakdown by category
The decline was broad, but it was not evenly spread. According to Statistics Canada's July building permits release, non-residential permits drove most of the drop, and the residential sector contributed less. Institutional projects such as hospitals, schools and public buildings were the single biggest swing.
Category
July 2026 value
Change from June
Total permits
$12.2 billion
-$2.6 billion (-17.3%)
Non-residential
$5.0 billion
-$1.9 billion (-27.1%)
Institutional
$1.7 billion
-$1.5 billion (-46.3%)
Industrial
$795.5 million
-$443.3 million (-35.8%)
Commercial
$2.5 billion
+$41.0 million (+1.7%)
Residential
$7.2 billion
-$701.2 million (-8.9%)
Multi-unit
$4.7 billion
-$531.8 million (-10.2%)
Single-family
$2.5 billion
-$169.4 million (-6.2%)
The residential numbers are the ones owners should read closely. Multi-unit permits accounted for about three-quarters of the residential decline. British Columbia, Alberta and Quebec led the multi-unit drop, and nine provinces and two territories posted decreases. Single-family values fell in eight provinces and two territories, led by Quebec.
Why one month can mislead
Two details cool the headline. First, June was unusually strong because of large institutional approvals, so part of July is simply a return to normal. Second, after adjusting for construction prices (constant 2023 dollars), July's permit value was down 17.5% from June but only 2.2% from July 2025. In current dollars, the total was actually 0.9% higher than a year earlier.
A single month of permit data can swing on a handful of large projects. The year-over-year comparison is the steadier signal, and it points to a softening rather than a collapse.
Ontario's 25.2% Drop Is Mostly Not About Houses
Splitting the provincial number
Ontario's permit value fell from about $6.1 billion in June to $4.6 billion in July. That is a large number. But the provincial table in the StatCan release shows where it came from.
Ontario, seasonally adjusted
June 2026
July 2026
Month change
Year-over-year change
Total
$6,144.2M
$4,596.1M
-25.2%
-4.9%
Residential
$2,500.9M
$2,380.0M
-4.8%
-14.0%
Non-residential
$3,643.2M
$2,216.0M
-39.2%
+7.3%
Ontario led the national institutional pullback with a $1.1 billion decline, one month after it drove institutional growth. The province also posted smaller industrial and commercial declines. In plain terms, most of Ontario's 25.2% is a reversal of large public-sector approvals, not a sudden stop in housing.
The residential signal that does matter
The more telling Ontario number is the year-over-year one. Residential permit values are down 14.0% from July 2025. That is a slower-moving trend, and it lines up with what CMHC has been reporting about weak ownership construction in the province.
Several provinces saw sharper residential declines than Ontario in July:
Saskatchewan: total -48.4%, residential -16.3%
Manitoba: total -23.9%, residential -17.6%
British Columbia: total -11.5%, residential -13.6%
Alberta: total -13.9%, residential -12.1%
Quebec: total -8.4%, residential -10.9%
New Brunswick: total +65.7%, the only province to rise
The 4,100 Single-Family Number, in Context
A typical month, not a cliff
Across Canada, 19,200 multi-unit dwellings and 4,100 single-family dwellings were authorized in July, a combined 10.1% drop from June. The national dwelling-count table gives the exact single-family figure as 4,073 units.
That is down 2.9% from June's 4,195 and 2.8% from July 2025's 4,192. May 2026 was lower still, at 3,894. So 4,100 is roughly what a normal month looks like right now. It is a seasonally adjusted monthly count, not an annual pace, and it is not an outlier.
The steeper drop was in multi-unit authorizations, down 11.5% in the month and 7.8% from a year earlier. Over the 12 months to July, municipalities authorized 297,100 multi-unit dwellings, down from 308,200 in the prior 12-month period. That is a decline of roughly 3.6%.
Note
Statistics Canada counts semi-detached houses and row houses as multi-family dwellings. Its single-family category includes single-detached homes, bungalows, linked homes, mobile homes and cottages. A drop in multi-unit permits can therefore include some ground-oriented housing, not only condo and rental towers.
Why a steady number still matters
A flat single-family count is not reassuring on its own. It means detached supply is holding at a level that has not been high to begin with, while the larger pipeline of new condos, townhouses and semis is thinning. For owners of existing detached homes, the relevant question is less "did single-family permits crash?" and more "is anything coming that competes with my house?"
The same split between single-family and multi-unit permits showed up earlier this year, as covered in Homeowner.ca's report on March building permits.
Reading the Pipeline From Permit to Completion
Where July sits in the process
Permits are the first stage. Housing starts, units under construction and completions follow. The same day StatCan released July permits, CMHC's August housing starts release covered the later stages.
Pipeline stage
Latest reading
Direction
Permits: total dwellings authorized (July)
23,249 units
-10.1% from June
Approved but not started (August, centres of 50,000+)
142,423 units
+0.7%
Starts: six-month trend (August)
244,149 units
-1.3%
Under construction (August, centres of 50,000+)
371,658 units
-0.4%
Completions (August, centres of 50,000+)
17,550 units
-11.2%
The completions figure checks out, but it needs context. It is August data, while the permit data are for July. And July completions had risen 8.1%, so part of August's drop is off a high base. Meanwhile, the number of projects with permits but no shovels in the ground keeps rising.
What CMHC expects next
CMHC deputy chief economist Kevin Hughes said starts "continued to trend slightly down in August," with the decline most notable in Ontario. He added: "While the current pace of starts is elevated compared to recent years, we expect the downward trend to continue as construction activity moderates in the coming months especially towards the end of the year."
A careful reading: fewer permits at the front, fewer completions at the back and a growing backlog of approved-but-idle projects suggest a pipeline that is narrowing modestly, not seizing up. One month does not confirm a trend, and a rising backlog could turn into starts if conditions improve.
A building permit is one of the first formal steps in construction, which is why economists treat permit data as a leading indicator. StatCan's survey covers about 2,400 municipalities representing 95% of the population, according to the Building Permits Survey documentation. CMHC also uses it as the reference frame for its own starts survey.
A permit is intent, not construction. CMHC's analysis of how permits lead housing starts puts the gap at roughly 2 to 10 months for single-detached homes and roughly 9 to 15 months for mid- and high-rise apartments. It also notes that developers may pause projects while waiting for better conditions. CMHC separately estimates that multi-unit buildings take 1 to 2 years to go from start to completion.
A simple framework for reading the release
Value versus units: dollar values can move on a few large institutional projects, while dwelling counts track housing directly. For supply questions, read the unit counts.
Month versus year: month-to-month changes are noisy. Year-over-year and 12-month totals show direction.
Headline versus split: always check residential versus non-residential before drawing a housing conclusion.
Preliminary versus revised: StatCan revises seasonally adjusted figures for the two previous months, so July's numbers can still change.
Tip
When a provincial headline looks dramatic, open StatCan's Table 2 and compare the residential line with the non-residential line. Ontario's July split is a clear example of why that check matters.
What This Means for Detached-Home Owners
The scarcity argument, stated carefully
The case for existing detached homes rests less on one permit report than on a pattern CMHC has described for months. In its September 10 supply-gap update, CMHC said new supply in most major markets is dominated by rentals, with ownership-oriented starts weakening, and that "a future supply crunch in the homeownership market is likely." In Toronto, it said the gap is increasingly concentrated in the ownership market, "where new construction remains exceptionally weak."
Deputy chief economist Aled ab Iorwerth put the risk this way: "new construction is slowing faster than demand. The key risk now is Canada underbuilds during this softer market and finds itself further short of housing when demand strengthens again."
For an Ontario owner of a detached house, that is the structural context. Limited new ownership supply means less competition from new builds when a resale home is listed. It does not set a price, a timeline or a guaranteed outcome. Resale values still depend on interest rates, local demand, inventory and the condition of the home itself.
This release does not show that detached permits collapsed. It does not prove that prices will rise, and it does not show an Ontario housing freeze. The single-family count was steady, and Ontario's big monthly drop was mostly institutional. Owners should treat July as one more data point in a slow-moving supply story, not as a signal to act on its own.
The Renovation Cost Side
Tariff pressure that is already in place
Fewer projects in the pipeline could, over time, affect how busy trades and suppliers are. The nearer-term pressure, though, comes from trade policy. Canada imposed a provisional 25% safeguard surtax on imported wood cabinets and vanities effective July 31, 2026, for up to 200 days while the Canadian International Trade Tribunal completes an inquiry due January 15, 2027. Goods from the U.S., Mexico, Chile, Israel and certain developing countries are exempt, and the measure also covers cabinet parts such as doors, drawers and frames.
Canada's September 8 counter-tariffs on selected U.S. goods add another layer. They apply rates of 15%, 25% or 50%, with steel, aluminum and furniture in the top band and appliances in the 25% band.
What measured costs actually show
Statistics Canada's second-quarter building construction price index showed residential construction costs up 0.5% in the quarter and 2.3% from a year earlier. Metal fabrications (+2.1%) and structural steel framing (+1.8%) led the increases, while wood, plastics and composites fell 0.3%. StatCan pointed to retaliatory tariffs disrupting supply chains and "an already constrained skilled trades workforce."
That is useful calibration. The measured pressure is concentrated in metals, not lumber. Toronto was one of only three centres where residential construction costs declined in the quarter. The index measures new-build contractor prices, not renovation quotes, so it signals direction rather than what a specific kitchen will cost.
Important
If a kitchen or bathroom project is on your calendar, ask contractors how long their quotes are valid, whether cabinets and vanities are imported and from where, and whether the price is fixed or subject to material adjustments. A firm, dated quote tells you more than a forecast about where costs are heading.
The monitoring calendar is short and specific. Statistics Canada releases August building permits on October 14, 2026. CMHC publishes September housing starts on October 16. StatCan will also revise July's seasonally adjusted figures when the August data come out.
A useful watchlist for owners:
Ontario residential permits year over year: whether the 14.0% decline widens or narrows
Single-family dwelling counts: whether they hold near 4,000 a month or start to slip
Approved-but-not-started units: whether the backlog of about 142,000 keeps growing or begins converting to starts
The third-quarter construction price index: whether metal-led cost pressure spreads to other categories
The cabinet safeguard inquiry: the tribunal's report is due January 15, 2027, and the provisional surtax can last up to 200 days
A single weak month does not change the outlook. A string of them in the residential lines would. That is the signal worth waiting for.
Angela Nightingale is the Senior Editor at Homeowner.ca with two decades of experience in digital publishing and content strategy. She has owned two homes, taken on her share of DIY projects, and learned what most guides fail to mention. She writes from the belief that the best home guidance comes from people who have lived through the decisions — and her goal is always to leave readers feeling confident, not overwhelmed.